Why lawmakers should focus on implementing a border-adjusted carbon tax, not carbon tariffs
Executive Summary
Given recent legislative developments in carbon border adjustments and carbon tariffs, U.S. policymakers must have the best available information about how the carbon-intensity performance of the American economy stacks up against the full range of global peers and competitors. This paper explains the difference between a carbon border adjustment and a carbon tariff and provides a preliminary analysis that casts doubt on the optimistic narrative underlying the movement toward carbon tariffs.
Breakthroughs in clean-energy technology and policy have given rise to claims that the U.S. is already a global leader in decarbonization. In fact, the U.S. falls in the middle of the pack globally in terms of carbon intensity across fossil fuels and manufacturing industries. The U.S. is much less carbon-intensive than some of the world’s largest emitters, such as China, India, and Russia. Still, it lags behind wealthy democratic peers, including the EU, the U.K., and Japan.
A carbon tax would be the most efficient policy for achieving deeper decarbonization and should incorporate a border adjustment to prevent carbon leakage and level the playing field between domestic and foreign producers. The author collaborated with researchers at FTI Consulting to estimate industry-level carbon intensity across the U.S. and other major economies. FTI researchers led an analysis that vetted and consolidated large amounts of data on carbon emissions and industry output. A detailed description of the data modeling methodology is provided in the appendix.
Introduction
The Biden administration has set ambitious climate goals for the United States: reducing domestic emissions by 50 to 52 percent relative to 2005 levels by 2030 and reaching net-zero emissions by 2050.1 Despite the bold targets, the administration has not supported an economywide policy in the U.S. to reduce emissions. Instead, the administration’s approach to mitigating climate change relies on tax subsidies and regulations. Most recently, lawmakers doubled down on this approach by passing the Inflation Reduction Act, which provides substantial tax breaks and subsidies for the U.S. clean energy industry.2
At the same time, there has been increasing support among U.S. lawmakers and policy analysts for a standalone “carbon border adjustment” policy.3 Although the policy is often called a “border adjustment,” it amounts to a tariff. The distinction matters: a border adjustment would be implemented in tandem with a domestic carbon tax, levying taxes on imported goods and offering rebates to manufacturers exporting their goods. A carbon tariff simply taxes imports based on their carbon content.
Proponents believe that by levying tariffs on imported goods from specific countries, the U.S. would be able to take advantage of its much less carbon-intensive goods and make foreign producers pay for their carbon-intensive exports to the U.S.4 For example, Senator Bill Cassidy (R-LA) has suggested he plans to introduce carbon tariff legislation that a spokesman described as “ensuring imports dirtier than American-made products are disadvantaged.”5 Senator Chris Coons (D-DE) and Representative Scott Peters (D-CA) introduced the FAIR Transition and Competition Act of 2021 that would levy tariffs on certain carbon-intensive imported goods.6 The tariff would be based on the estimated cost U.S. industries face to comply with environmental regulations, but would not be offset by factoring in U.S. government subsidies.
Enthusiasm for these measures has grown as the EU moves closer to implementing its own carbon border adjustment (CBAM). The European Union will start phasing in CBAM in October.7 The EU CBAM aims to protect EU producers’ competitiveness and incentivizes its trading partners to adopt more ambitious climate policies by levying a fee on imported goods. The import fee would mirror what EU producers are paying for emissions allowances under the bloc’s emissions trading system. The EU CBAM does not include export rebates, which makes it de facto carbon tariffs. Some U.S. lawmakers have criticized the EU CBAM as unfairly penalizing the U.S. – which in these arguments tends to be cast as a leader in cutting emissions. For example, Senator Kevin Cramer (R-ND) asserted in a recent Wall Street Journal op-ed, “The CBAM as drafted would disadvantage the U.S., especially our small businesses and manufacturers, even though the U.S. and EU have nearly identical environmental performance and emissions standards.”8 And a spokesman for Senator Cassidy called the EU measure “a flawed model focused on carbon pricing and domestic protection.”9
Other legislation already in the mix includes the Clean Competition Act introduced by Senator Sheldon Whitehouse (D-RI) in June 2022, which would impose a narrow-based border-adjusted carbon tax targeted at goods across certain carbon-intensive industries,10 and the bipartisan PROVE IT Act introduced by Senators Coons and Kevin Cramer (R-ND) in June 2023, directing the Department of Energy to conduct a product-level emissions study, which could be used to inform the design of carbon tariffs or a border-adjusted carbon tax.11
Given the recent interest in carbon border adjustments, it is critical for U.S. policymakers to have the best available information about how the carbon-emissions performance of the American economy stacks up against the full range of global peers and competitors. This paper provides a preliminary analysis that casts doubt on the optimistic narrative underlying the movement toward carbon tariffs. While it is true that the U.S. fares much better than less-developed economies such as China, U.S. carbon-intensity performance lags behind those of advanced industrialized peers, including the EU.
The paper then offers insights into the implications of implementing carbon border adjustments or tariffs from the perspectives of emissions reduction, economic competitiveness, trade relationships, and geopolitical dynamics.
Understanding carbon taxes, border adjustments, and implementation
Although the Inflation Reduction Act and related policies will contribute to reducing emissions, they are far from ideal. Lawmakers should still consider enacting an economywide carbon tax, widely recognized by economists as the best policy to incentivize decarbonization.12 A carbon tax would price the carbon emissions associated with the production and consumption of goods and services. Consumers would be encouraged to switch from carbon-intensive products rendered more expensive by the tax to cleaner ones.
Regulations and tax breaks are inefficient by comparison.13 They require lawmakers to design policies sector-by-sector. Regulations are vulnerable to administrative and legal challenges, which could cause significant delays in policy implementation.14 Tax subsidies require the government to pick winners and losers among industries. Although they will encourage the development of clean technologies, they do not provide direct incentives to reduce fossil fuel consumption. Additionally, tax subsidies make energy cheaper and might increase overall energy consumption.15
There are two frequent concerns with a carbon tax. First, it would place carbon-intensive U.S. industries at a competitive disadvantage globally. Second, it could encourage U.S. companies to move carbon-intensive production to locations where climate policies are less stringent, costing U.S. domestic jobs and reducing the efficacy of the policy in reducing emissions. To address these concerns, lawmakers should apply a border adjustment to any carbon tax enacted in the U.S. A border adjustment would apply the carbon tax to imports and rebate the carbon tax on goods produced in the U.S. but exported to foreign countries.
Border adjustments are not unique to carbon taxes. They are widely used in taxation. Other types of taxes, such as value-added tax (VAT) and specific excise taxes, are border adjusted.16 Value-added tax is a broad-based consumption tax that is collected at each stage of the value chain. Excise tax is levied on certain types of products or activities; examples include excise taxes on sugar and alcohol. Border adjustments have also been debated in the context of business taxation.17
While a carbon border adjustment solves the competitiveness problem, it comes with administrative complexities. For one, it is difficult to determine the amount of carbon emissions embedded in a specific product for calculating the appropriate import tax or export rebate. Carbon emissions of a specific product are not readily observable. It would require emissions measuring, validating, and auditing to generate product-level emission data.
Product-level emission measurement is a new area that requires significant development for implementing border adjustments under a carbon tax. Existing emissions data is available at the national aggregate level, sector level, and manufacturing facility level. However, product-level emissions data is scarce. Methodologies would need to be developed to track additive emissions along the value chains to estimate emissions associated with a specific product.18
The large data gap and underdevelopment in product-level emissions data have drawn considerable interest recently. For example, the International Energy Agency (IEA) released a study this year on improving measuring and reporting carbon intensity data for the steel industry to transition to net-zero.19 According to the study, although existing steel industry emissions data can be used as a starting point, substantial work would be required to produce facility- and product-level emissions data that is interoperable, transparent, and meaningful for a net-zero transition.
The U.S. falls in the middle of the pack globally in carbon intensity
Carbon intensity indicates the amount of emissions produced from one unit of economic output. Differences among countries’ carbon intensity would directly impact the amount of import tax their exporters would be subject to under carbon border adjustments or tariffs. While developed countries’ total emissions have stabilized in recent decades, developing countries’ emissions have been growing quickly. Typically, more developed countries like the U.S. and Germany are much less carbon-intensive than developing countries, but their economies are so large that they still have high overall emissions.20
Table 1: The U.S. is much less carbon-intensive than India, Russia, and China, but lags behind the U.K., the EU, and Japan
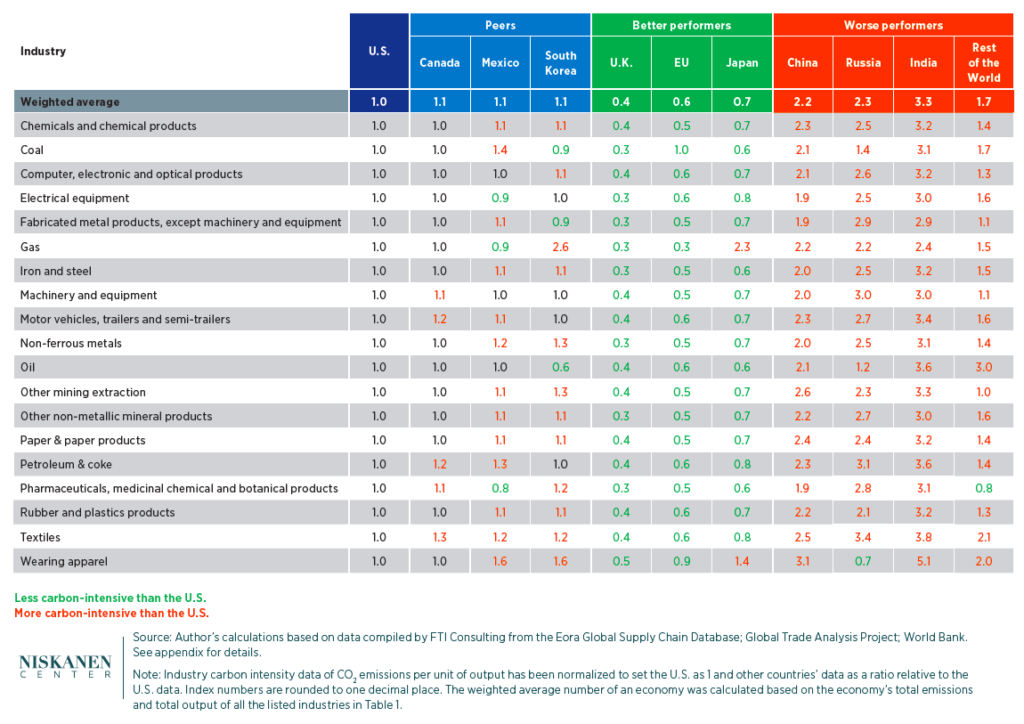
Table 1 presents a weighted index of selective industries’ carbon intensity across the U.S. and other economies, including Canada, China, the EU, India, Japan, Mexico, Russia, South Korea, the U.K., and the rest of the world.21
These jurisdictions include the world’s largest emitters, such as China, the U.S., India, and Russia, and the U.S.’ major trading partners, such as China, Canada, and Mexico.22
Readers should view the data in Table 1 with caution, as emissions measuring and reporting methodologies are not standardized globally. Industries and companies across different countries might use various emissions measuring and reporting methodologies and standards, which might lead to discrepancies among different emissions datasets.
As noted above, some U.S. lawmakers and policy analysts have proposed levying carbon tariffs on imports absent a domestic carbon tax. They suggest this would allow the U.S. to leverage its low carbon-intensity advantage to boost domestic manufacturing industries.23
However, the data in Table 1 indicates that the U.S. falls in the middle of the pack compared to the rest of the world. Although the U.S. is much less carbon-intensive than some of the largest emitters, it lags behind other large, developed economies.
Table 1 suggests that the U.S. is much less carbon-intensive than some of the world’s largest emitters, such as China, India, and Russia. Among these three large emitters, India is the most carbon-intensive across the board, followed by Russia and China. For most fossil fuel and manufacturing industries, India is at least three times as carbon-intensive as the U.S. Some particularly carbon-intensive industries in India are manufacturing of wearing apparel and textiles, which are approximately five and four times as carbon-intensive as the U.S. industries.
China is approximately twice as carbon-intensive as the U.S. across all the fossil fuels and manufacturing industries. The most carbon-intensive industries in China include the manufacturing of wearing apparel, other mining extraction, and manufacturing of textiles, which are 3.1, 2.6, and 2.5 times as carbon-intensive as the U.S. industries, respectively.
Russia is also significantly more carbon-intensive than the U.S. across most industries, including fabricated metal products, machinery and equipment, textiles, and petroleum and coke products. Russia is 2.3 times as carbon-intensive as the U.S. across the listed industries in Table 1.
Conversely, the U.S. is outperformed by its peers, including the U.K., the EU, and Japan across most industries. For example, according to the estimates in Table 1, the U.K. is 60 percent less carbon-intensive than the U.S. across the listed industries. It is significantly less carbon-intensive than the U.S. in electrical equipment, fabricated metal products, and other nonmetallic mineral products.
The EU is 40 percent less carbon-intensive than the U.S. across the listed industries in Table 1. This aligns with the International Energy Agency’s estimates that the EU was about 40 percent less carbon-intensive than the U.S. across the economy in 2021.24
Japan overall is less carbon-intensive than the U.S. by 30 percent, despite some Japanese industries, such as gas, being more carbon-intensive than their U.S. counterparts.
The U.S. is very similar to Canada across all industries in terms of carbon intensity. As close neighbors with similar income levels, the two countries have significantly interconnected economies and energy infrastructures.
Mexico and South Korea’s carbon intensity data is also close to the U.S.’, with a few industries being more carbon-intensive. For example, Mexico’s manufacturing of wearing apparel and coal industries are 1.6 times and 1.4 times as carbon-intensive as the U.S.’. South Korea’s gas industry is particularly carbon-intensive at 2.6 times the level of the U.S. gas industry.
Carbon tariffs and geopolitics don’t mix well
A carbon tariff policy seems particularly desirable for lawmakers who are seeking to achieve geopolitical goals by countering countries such as China and Russia. They see the fact that these countries are much more carbon-intensive than the U.S. across many industries as an opportunity to levy tariffs on their exports, making them pay for their emissions and simultaneously improving U.S. competitiveness.
But implementing standalone carbon tariffs absent a domestic U.S. carbon tax would be problematic. First, this protectionist policy would violate the World Trade Organization’s (WTO) non-discriminatory rules.25 Since there is no federal carbon price in the U.S., a carbon tariff would treat U.S. domestic manufacturers more favorably than foreign producers. Some experts argue that the environmental exception clause, Article XX of the General Agreement on Tariffs and Trade, could be used to justify such a policy.26 Even if a carbon tariff was granted an exception under the WTO rules, it would still be difficult to justify it to the U.S.’ trading partners—that the U.S. makes foreign producers pay for a carbon price but exempts its domestic producers. And the problems grow even more severe if trading partners viewed as adversaries are included but perceived allies are granted waivers.
Second, tariffs negatively impact the economy and could lead to tit-for-tat trade wars. For example, the Section 232 steel and aluminum tariffs enacted by President Trump in 2018 had a negative impact on economic growth and employment. The Tax Foundation estimated that repealing the Section 232 steel and aluminum tariffs would boost long-run GDP by 0.02 percent and add more than 4,000 jobs.27 In retaliation, the EU imposed tariffs on certain U.S. imports. To resolve the trade tension, the Biden administration had to negotiate a deal with the EU for both sides to pause most of the tariffs for two years.28
Third, lawmakers should not distort climate policy with foreign policy goals. Some lawmakers have proposed using carbon tariffs to punish carbon-intensive countries such as China but exempt other carbon-intensive allies such as India.29 This approach is problematic because, as shown in Table 1 above, India is much more carbon-intensive than the U.S., even more so than China and Russia. If lawmakers consider emissions reduction a top priority, large emitters such as India should not be exempted from the carbon tariffs.
Additionally, imposing tariffs on more carbon-intensive imports without implementing a domestic carbon tax provides little incentive for U.S. producers to further decarbonize their production processes. As indicated in Table 1, the U.S. has significant room to improve in terms of cutting emissions across manufacturing industries.
Last but not least, the world’s largest emitters only export a small portion of their total emissions. Most of their emissions are embedded in products for domestic consumption. For example, in 2018, more than 80 percent of China’s emissions were for domestic consumption. The emissions associated with the U.S.’ total imports from China in 2018 only accounted for 4 percent of China’s total emissions. The U.S. could have only a minimal impact on these large emitters’ emissions with a carbon tariff policy.30 Policymakers should focus on implementing efficient domestic climate policies to drive down emissions.
Conclusion
This paper finds that the U.S. is significantly less carbon-intensive than large emitters such as China, Russia, and India, but it is outperformed by its economic peers, such as the EU, Japan, and the U.K. U.S. lawmakers should therefore focus on meaningful domestic climate policies, such as a border-adjusted carbon tax, to drive down emissions.
Enacting carbon tariffs on imported goods without a domestic carbon tax would raise significant challenges. A policy taxing carbon emissions associated with imports should be linked to a domestic carbon price.
Further research and analysis in measuring industry and product-level carbon intensity across countries would be important for helping lawmakers understand the implications of a carbon border adjustment.
Appendix – Methodology of the study
For the Niskanen Center project, FTI Consulting used a combination of data sources to estimate the industry-level carbon-intensity of the U.S. economy and its trading partners.
These are data sources and the steps taken to analyze them:
- Industry-level output data in US dollars by country was collected from the GTAP 10 database.31
- Industry-level carbon intensity data (tons of CO2 emissions per US dollar of output) was collected from the Eora database.32 Eora industry definitions by country were often inconsistent, so they were mapped to the closest GTAP sectors33 and countries.34 In instances where no data was available, a reasonable proxy was used, such as a country from the same region of the world with a similar level of income providing its emissions intensity for a particular type of manufacturing to fill in the data gap in the Eora database.
- The Eora database includes separate columns for Scope 135 (emissions per dollar of output from direct energy use by sector) and Scope 336 (includes the emissions related to the supply chain and use of finished products).For this analysis, the Scope 1 column was used to compare the direct emissions by sector and country against one another and to estimate emissions.
- To further refine the Eora parameters, output by country and sector from GTAP was multiplied by the emissions factors from Eora to estimate national emissions. These were then compared to national emissions as reported by the World Bank.37 This comparison was used to create an adjustment factor on a country-by-country basis to adjust the by-country and sector emissions up or down and make the estimated national emissions and estimated global emissions by sector consistent with the World Bank data.
- Industry-level carbon intensity data (tons of CO2 emissions per US dollar of output) was collected from the Eora database.32 Eora industry definitions by country were often inconsistent, so they were mapped to the closest GTAP sectors33 and countries.34 In instances where no data was available, a reasonable proxy was used, such as a country from the same region of the world with a similar level of income providing its emissions intensity for a particular type of manufacturing to fill in the data gap in the Eora database.
- Industry-level carbon intensity data has been normalized to set the U.S. as 1 and other countries’ data as a ratio relative to the U.S. data. The weighted average number of an economy was calculated based on the economy’s total emissions and total output of all the listed industries in Table 1.
- CO2 emissions (metric tons per capita), The World Bank.
Notes
1. “FACT SHEET: President Biden Sets 2030 Greenhouse Gas Pollution Reduction Target Aimed at Creating Good-Paying Union Jobs and Securing U.S. Leadership on Clean Energy Technologies,” The White House, 2021.
2. Shuting Pomerleau, “Now that the Inflation Reduction Act passed, do we still need a carbon tax?” Niskanen Center, 2022.
3. “Senate chatter grows louder on carbon tariff,” Emma Dumain, E&E News, March 8, 2023.
4. “As European tax looms, a border fee draws bipartisan focus,” Benjamin J. Hulac, Roll Call, April 12, 2023; “Senators introduce PROVE IT Act in push to protect American manufacturing,” Fox News, July 12, 2023.
5. Hulac, “Border fee.”
6. “FAIR Transition and Competition Act of 2021 One Pager,” Office of Senator Chris Coons, 2021.
7. Shuting Pomerleau, “What’s in the latest EU carbon border adjustment provisional agreement?”, Niskanen Center, 2023.
8. Kevin Cramer, “The EU Goes Rogue on Climate Policy With CBAM,” Wall Street Journal, Dec. 14, 2022
9. Hulac, “Border fee.”
10. Shuting Pomerleau, “What’s in the carbon border adjustment bill introduced by Senator Whitehouse?” Niskanen Center, 2022.
11. Shuting Pomerleau, “What is in the PROVE It Act introduced by Senator Coons and Senator Cramer?” Niskanen Center, 2023.
12. “Economists’ Statement on Carbon Dividends,” Climate Leadership Council, 2019. Carbon dividends refer to distributing the revenue raised by a carbon tax to households to mitigate its distributional impact.
13. Shuting Pomerleau and Ed Dolan, “Carbon Pricing and Regulations Compared – An Economic Explainer,” Niskanen Center, 2021.
14. John Adler, “Legal And Administrative Pitfalls That May Confront Climate Regulation,” Niskanen Center, 2021.
15. Shuting Pomerleau, “ Inflation Reduction Act.”
16. Shuting Pomerleau, “Border Adjustments in a Carbon Tax,” Niskanen Center, 2020.
17. Kyle Pomerleau and Stephen Entin, “The House GOP’s Destination-Based Cash Flow Tax, Explained,” Tax Foundation, 2016
18. More in-depth discussion of how to track product-level emissions can be found in Shuting Pomerleau, “Administrative Costs of a Carbon Tax,” Niskanen Center, 2021.
19. Levi et al., “Emissions Measurement and Data Collection for a Net Zero Steel Industry,” International Energy Agency, 2023.
20. Shuting Pomerleau, “Emissions embedded in global trade,” Niskanen Center, 2022.
21. Industry-level emissions data across countries was collected from the Eora global supply chain database, which was then mapped to the country and sector lists under the Global Trade Analysis Project. The World Bank’s national total emissions data was used to recalibrate the Eora emissions data to correct for outlier data points. The Eora global supply chain database has been used widely among institutions including Deloitte, KPMG, Ernst & Young, McKinsey Global Institute, Amazon.com, the European Commission, the IMF, the World Bank, and the UN.
22. China, Canada, Mexico, Japan, the U.K., South Korea and India are the top trading partners of the U.S. Between 2017 and 2021. In 2019, China, the U.S., India, Russia, Japan, and South Korea were among the world’s top 10 emitters. Shuting Pomerleau, “Emissions embedded in global trade,” Niskanen Center, 2022.
23. Price St. Clair, “Crawling Towards a Carbon Tariff?” The Dispatch, June 9, 2023.
24. “CO2 emissions intensity of GDP, 1990-2021,” International Energy Agency, 2022.
25. Jennifer Hillman, “Changing Climate for Carbon Taxes,” German Marshall Fund of the United States, 2013.
26. Hillman, “Carbon Taxes.”
27. Alex Durante, “How the Section 232 Tariffs on Steel and Aluminum Harmed the Economy,” Tax Foundation, 2022.
28. Shuting Pomerleau, “What are the implications of the new U.S.-EU deal on steel and aluminum?” Niskanen Center, 2021.
29. Jeremy Beaman, “Daily on Energy: Interview – Sen. Bill Cassidy makes the case for a ‘foreign pollution fee’,” Washington Examiner, May 19, 2023.
30. Shuting Pomerleau, “Emissions embedded in global trade,” Niskanen Center, 2022.
31. GTAP 10 Data Base, Purdue University Center for Global Trade Analysis.
32. The Eora Global Supply Chain Database, KGM & Associates.
33. GTAP 10 Data Base Sectors, Purdue University Center for Global Trade Analysis.
34. GTAP 10 Data Base Regions, Purdue University Center for Global Trade Analysis.
35. Scope 1 and Scope 2 Inventory Guidance, Environmental Protection Agency.
36. Scope 3 Inventory Guidance, Environmental Protection Agency.
37. CO2 emissions (metric tons per capita), The World Bank.