

Beginning of Freedom - Issue #67
Beginning of Freedom - Issue #67
Bitcoin and Ethereum back to resistance while the Fed continues with its hawkish signaling.

Fundamental overview
Last week, the headline CPI inflation number came in at 6.4%—above the 6.2% forecast, but still below December’s 6.5%—but if we look at inflation data more closely, we can see that the recent decline since summer 2022 is mostly due to the energy and commodities sectors. On the other hand, prices in the service sector have been rising continuously since late 2021, which is important because this sector tends to be particularly sticky when it comes to tackling inflation. While this did have a negative impact on stocks, as one would expect, you’ve also probably noticed that Bitcoin rallied quite a bit since the release. So, what gives?
In this macro-driven environment, where US economic events are watched as closely in crypto as they are in TradFi (not least because they can cause even more volatility on BTC than legacy markets), it’s sometimes easy to forget that crypto isn’t essentially tied to the US in any way. Of course, the US does remain the number one market, but while the Fed continues with its hawkish signaling, there’s a very different trend emerging elsewhere. Namely, the third and fourth largest central banks—the People’s Bank of China (PBoC) and the Bank of Japan (BoJ)—have begun injecting more into the global liquidity cauldron than the Fed can drain out. Especially with China, the new narrative has been one of a return to its expansive pre-pandemic growth, as its incredibly strict (and economically devastating) zero-covid policy was abandoned, driving the PBoC to inject cash into the economy at unprecedented rates. Hence, some of this non-US liquidity makes its way into crypto, and this shouldn’t be surprising. After all, a key point of Bitcoin is its borderless nature, and we shouldn’t forget this by focusing on US macro too narrowly.
Bitcoin
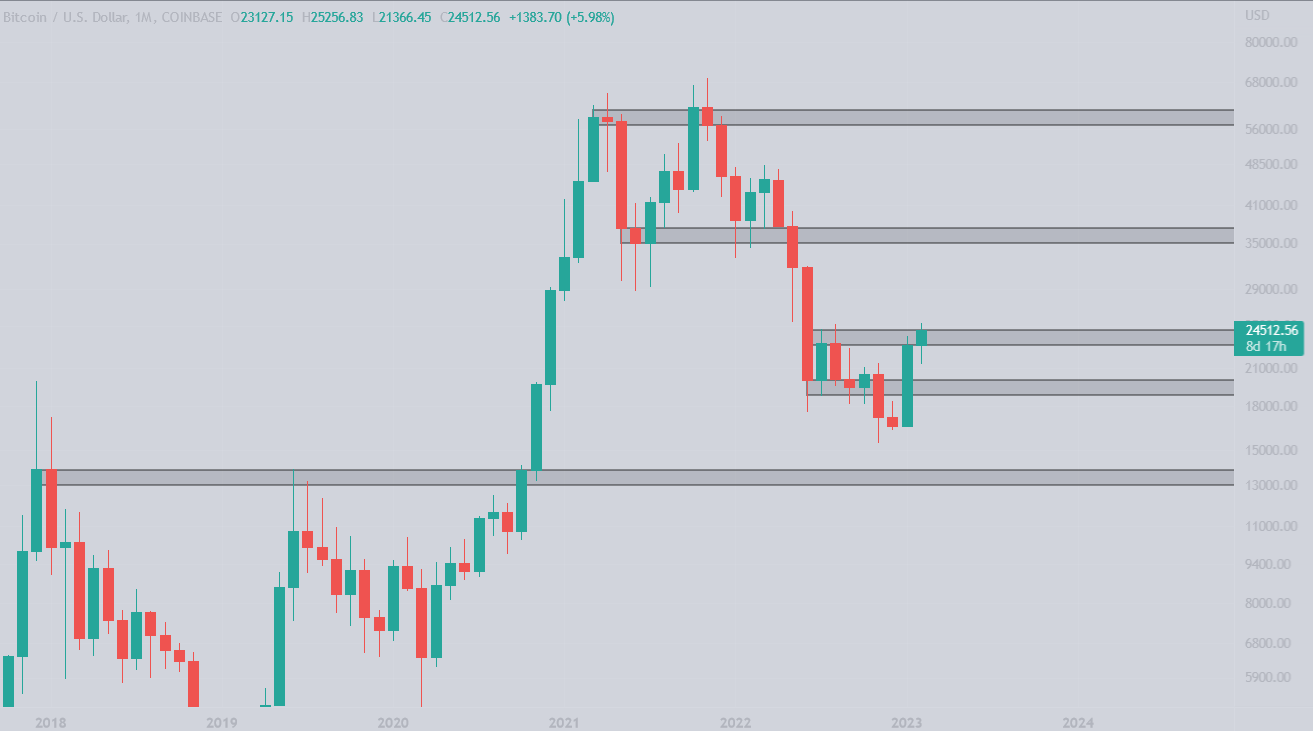

Bitcoin pushes back to the summer range high at ~$25,000.
We were looking for a bigger pullback, somewhere to the $20,000 region, which is a monthly support, but bulls seem to be in control for now. If you follow me on Twitter you probably saw the macro chart I shared which indicates that a weekly close above the downtrend line (not drawn on this chart) indicates further upside towards the first goal at $32,000.
A bigger retrace and bounce wouldn’t be that bad for more continuation as a higher low on higher timeframes would be formed which indicates a strong structure. Now we are stuck below the resistance for the second time, without any idea how this plays out.
The summer range high is a hard nut to crack, so from the monthly standpoint there is not much you can do, except maybe short. However, bears and shorters are not having the best time since the start of the year so consider that before doing anything stupid.
The daily timeframe gives us an insight on what is going on at the range high. Bulls tried to break above the level multiple times, but bears still seem to be holding their ground for now. The amount of shorts that entered here is immense.
The question is, who will prevail?
Usually the more times a level is tested the weaker it gets, but given the fact that macro (US macro, that is) is still not doing well and bulls could run out of ammo, who knows.
SPX, Gold and DXY
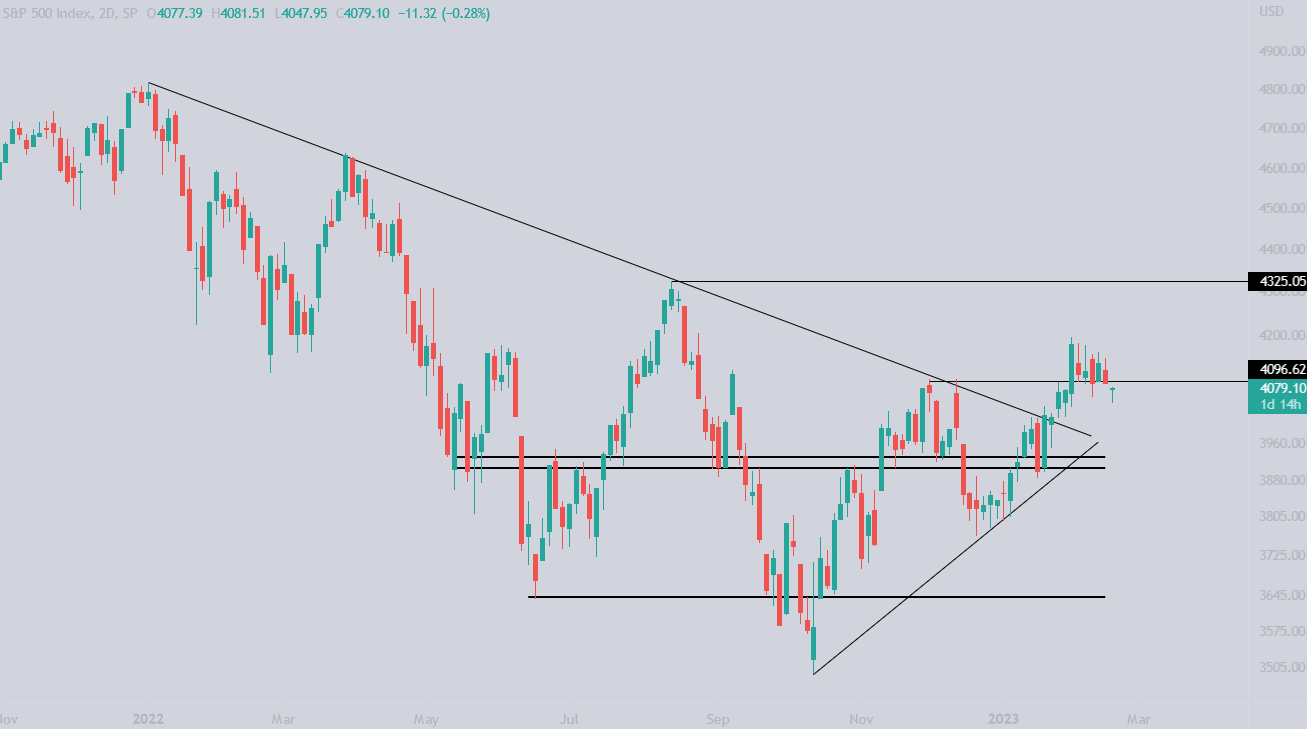
The S&P 500 has not done much last week, except retrace the big green candle as well as close below the double top formation from December 2022.
The levels to monitor remain the same as the previous week. As long as we are below the December highs, we want the downtrend line to hold, which is in confluence with the support we have drawn half a year ago.
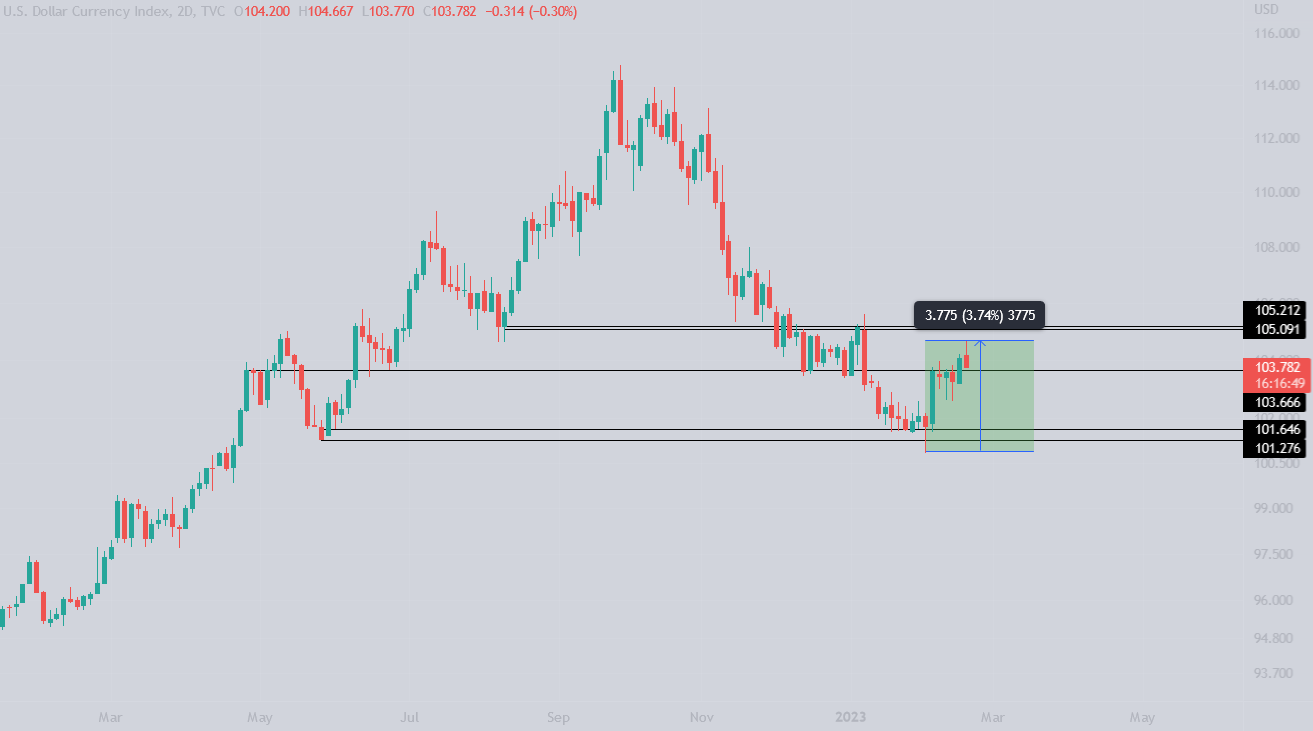
The US dollar index started showing some strength and managed to break above the 103 level proving that it is still alive. The real test comes at the 105 level. A strong break above would indicate that the dollar will continue to rise and risk-on assets will take a hit.
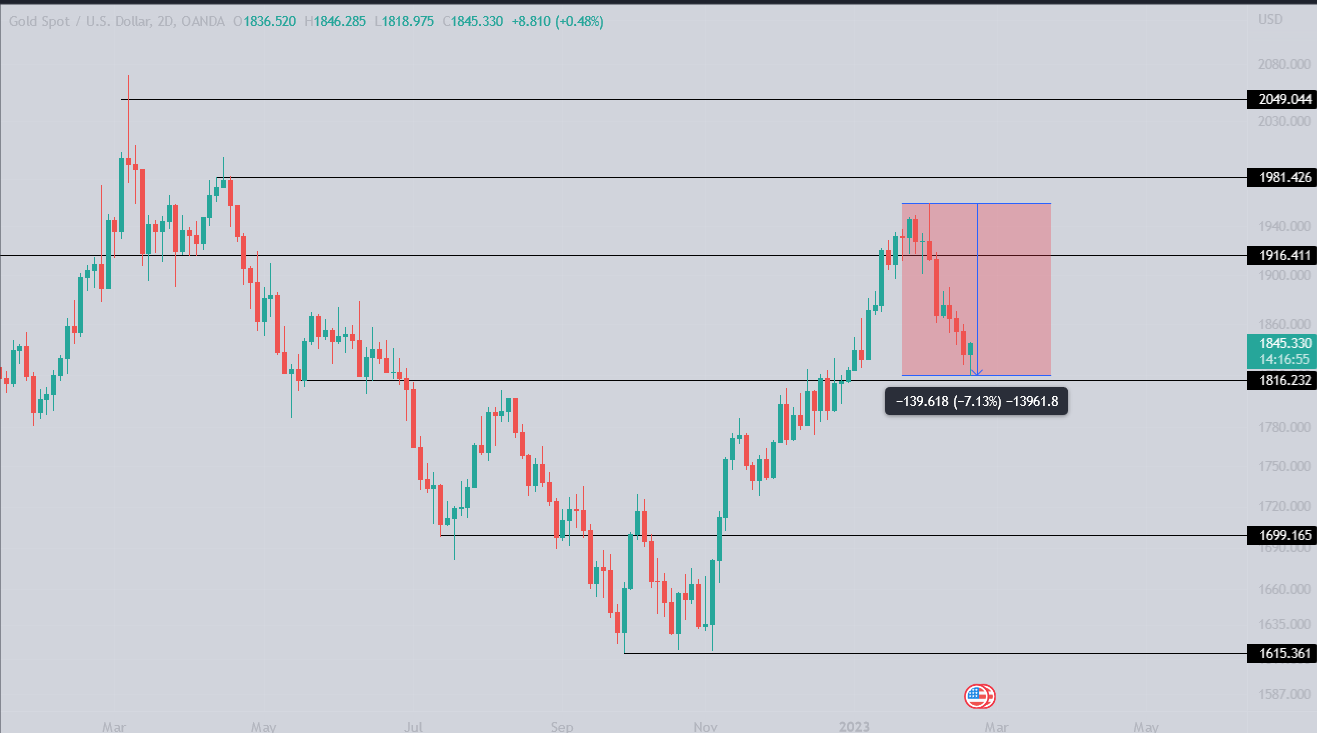
Among the assets in this letter, gold is performing the worst.
This isn’t too surprising now, as gold and a strong dollar aren’t exactly the best of friends. As you can see in this example, DXY pumped 3% and Gold dumped 7%. Gold has usually been used as a store of value for “tough times”, inflation, global conflicts and so on, but with the start of Bitcoin we got a new form of money and a store of value which could capture some liquidity from gold in the long term.
Anyway, the level to hold here is 1816, in case gold bulls don’t defend this level, we might just see lows below 1700 again.
Ethereum
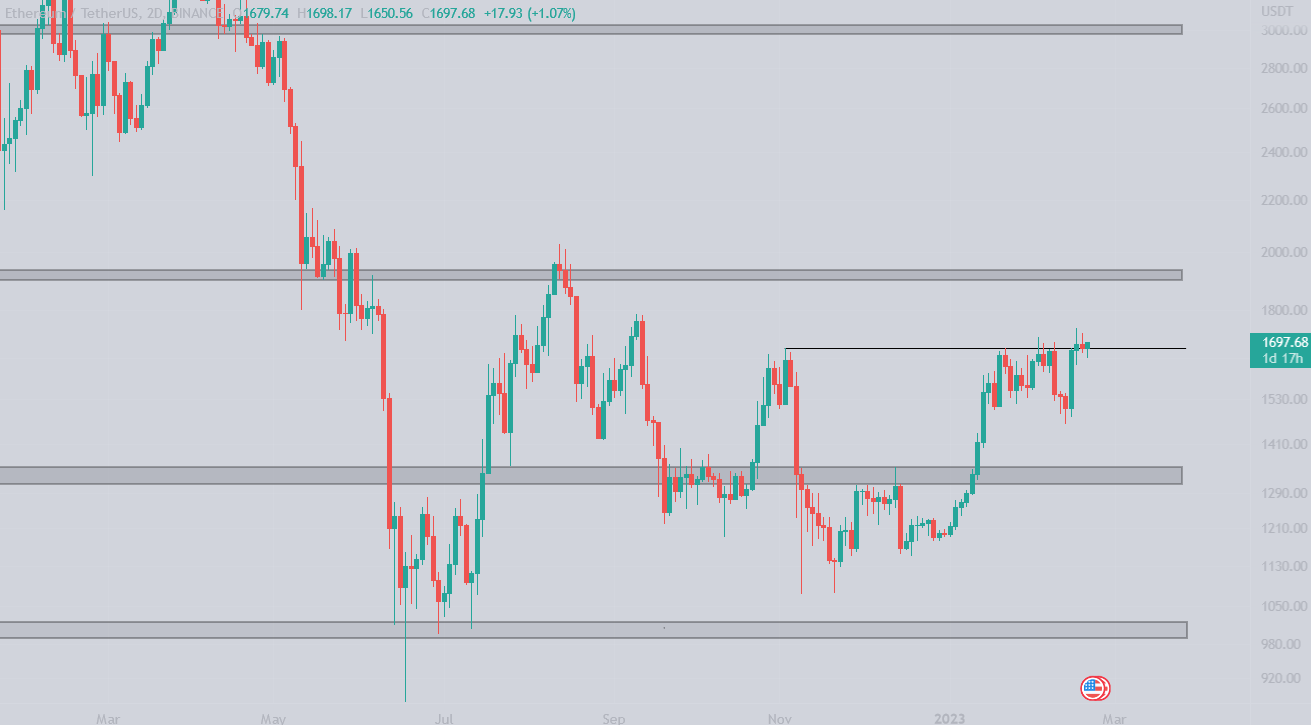
Bitcoin is back to resistance, and so is Ethereum.
We did get the pullback we talked about, however the levels that I was bidding were not reached this time. ETH printed a higher low at $1461, leaving my $1300-$1400 bids untouched. Similarly to Bitcoin, Ethereum bulls are also trying to push above resistance to reach the range high slightly above $2000.
The $2000 level seems like a promised land for bulls as they have been patiently waiting for it since the Merge in September. Accumulation under resistance is considered bullish and just like with Bitcoin, if bulls still have ammo I expect this level to be broken this week.
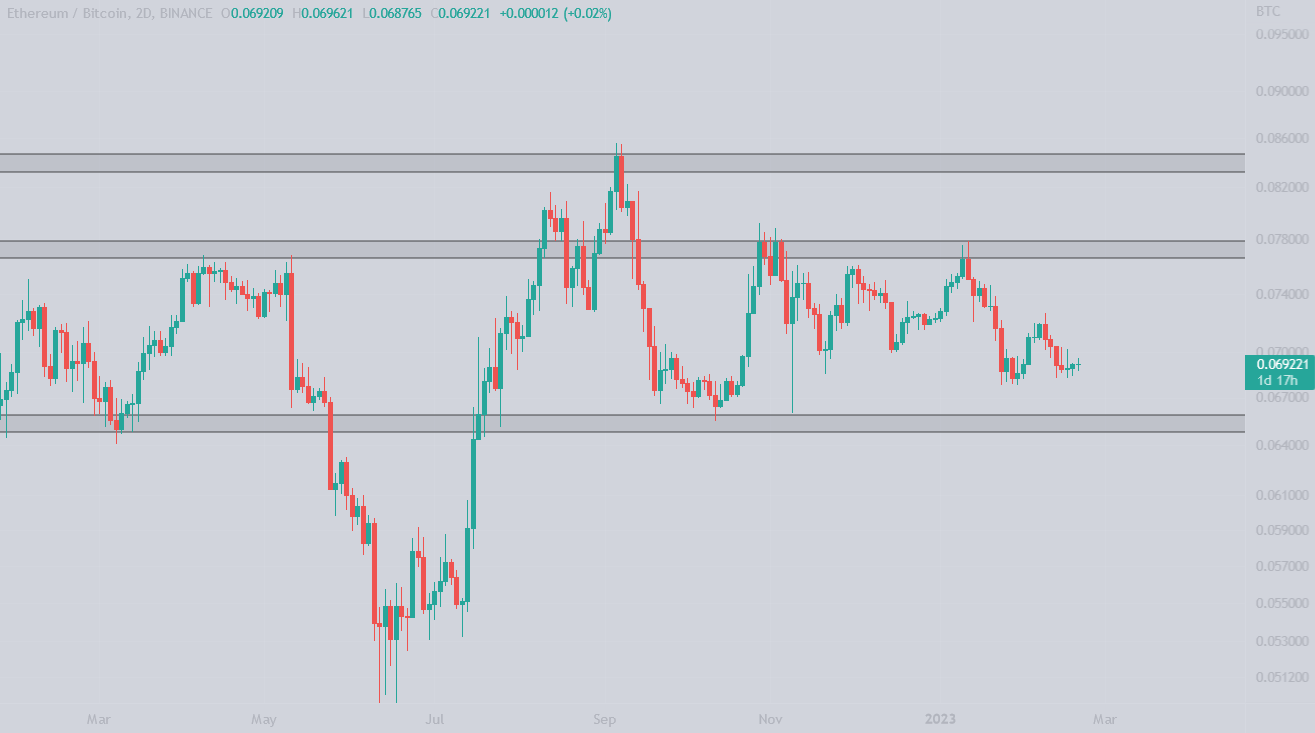
ETH/BTC is still teasing us by approaching the 0.065 BTC level, but far enough not to think about buying it.
It all depends on the USD pair: if it manages to break $1700 we could see ETH/BTC take off again towards 0.078 BTC, whereas if it’s rejected at $1700 we could finally see our bids get filled.
Blood’s content recap
Bitcoin Dollar-Cost Averaging Strategy article
“Master Bitcoin DCA
The simplest way to build wealth, with low risk.
- How to Start
- Risks/Benefits
- Step-by-step guide
- Real-time example
Now is the perfect time to start.
Share with friends if you find this helpful”
Bitcoin Macro chart”
“Simple, yet effective TA on Bitcoin weekly.
1. Breakout above the downtrend line (waiting weekly confirmation)
2. Waiting for it to break above the 2022 summer highs
3. Ride it to $32000
Easy.”
Concluding notes
In spite of the more positive non-US liquidity environment, I still need to conclude by mentioning a couple of key points in terms of US markets. I don’t know if you’ve noticed, but Coinbase stock has been rallying recently, and it’s currently sitting just above a 2x of the $31.55 low that it printed early this year. This isn’t too strange given what BTC has been doing, but if you’re interested in trading it, keep in mind that its earnings report is coming out tomorrow. The expectation is for earnings to be well in negative territory, but the key question is whether they will be as bad as the forecasts suggest. And if you’re wondering why a company that’s losing money would have its stock rally, the answer lies in the fundamental principle of equities: prices don’t just reflect current cash flows, but expected future cash flows as well. Hence, especially if crypto continues to perform well, Coinbase could start bringing in loads of money, which explains the rally. Finally, don’t forget about Wednesday’s FOMC minutes either: even though non-US liquidity seems to be making its way to crypto, the good old FOMC volatility isn’t going anywhere anytime soon.
Thanks Bloodgood !!!
Thanks for the excellent information and wisdom !
And thanks for the trading training book chapters on your website.
I really like your world affairs approach to crypto. Hopefully we shall rally in the next few days ?
Regards,
Carlos